basilh@virginia.edu
@basilhalperin
Plausibly the most shocking graph I’ve ever seen from an economics paper, speaking frankly, is the following graph of suicide rate by month, from Hansen and Lang (2011):

The black line is the suicide rate for 14-18 year olds, versus the dashed line of the 19-25 group. This is US data for 1980 to 2004.
What sticks out is a large decrease in teen suicide rates during the summer vacation months of June/July/August. In contrast, the somewhat older group sees, if anything, an increase in suicide rates in the summer. There’s also a drop in high school suicides in December, around winter vacation.
This is emphatically not causal evidence, but it is enough to make one wonder: is there a causal relationship between school and teenage suicide?
Honestly, when I first saw the Hansen and Lang graph, I figured that it must be just noise. Fortunately, the NBER has nicely organized the NCHS Multiple Cause-of-Death mortality data, which made it pretty straightforward to replicate the graph.
Better (“better”) yet: the original Hansen-Lang paper runs through 2004 but data is now available through 2019, so the replication also allows for an extension with a 60% higher number of years of data.
The pattern remains with the 15 years of new data:
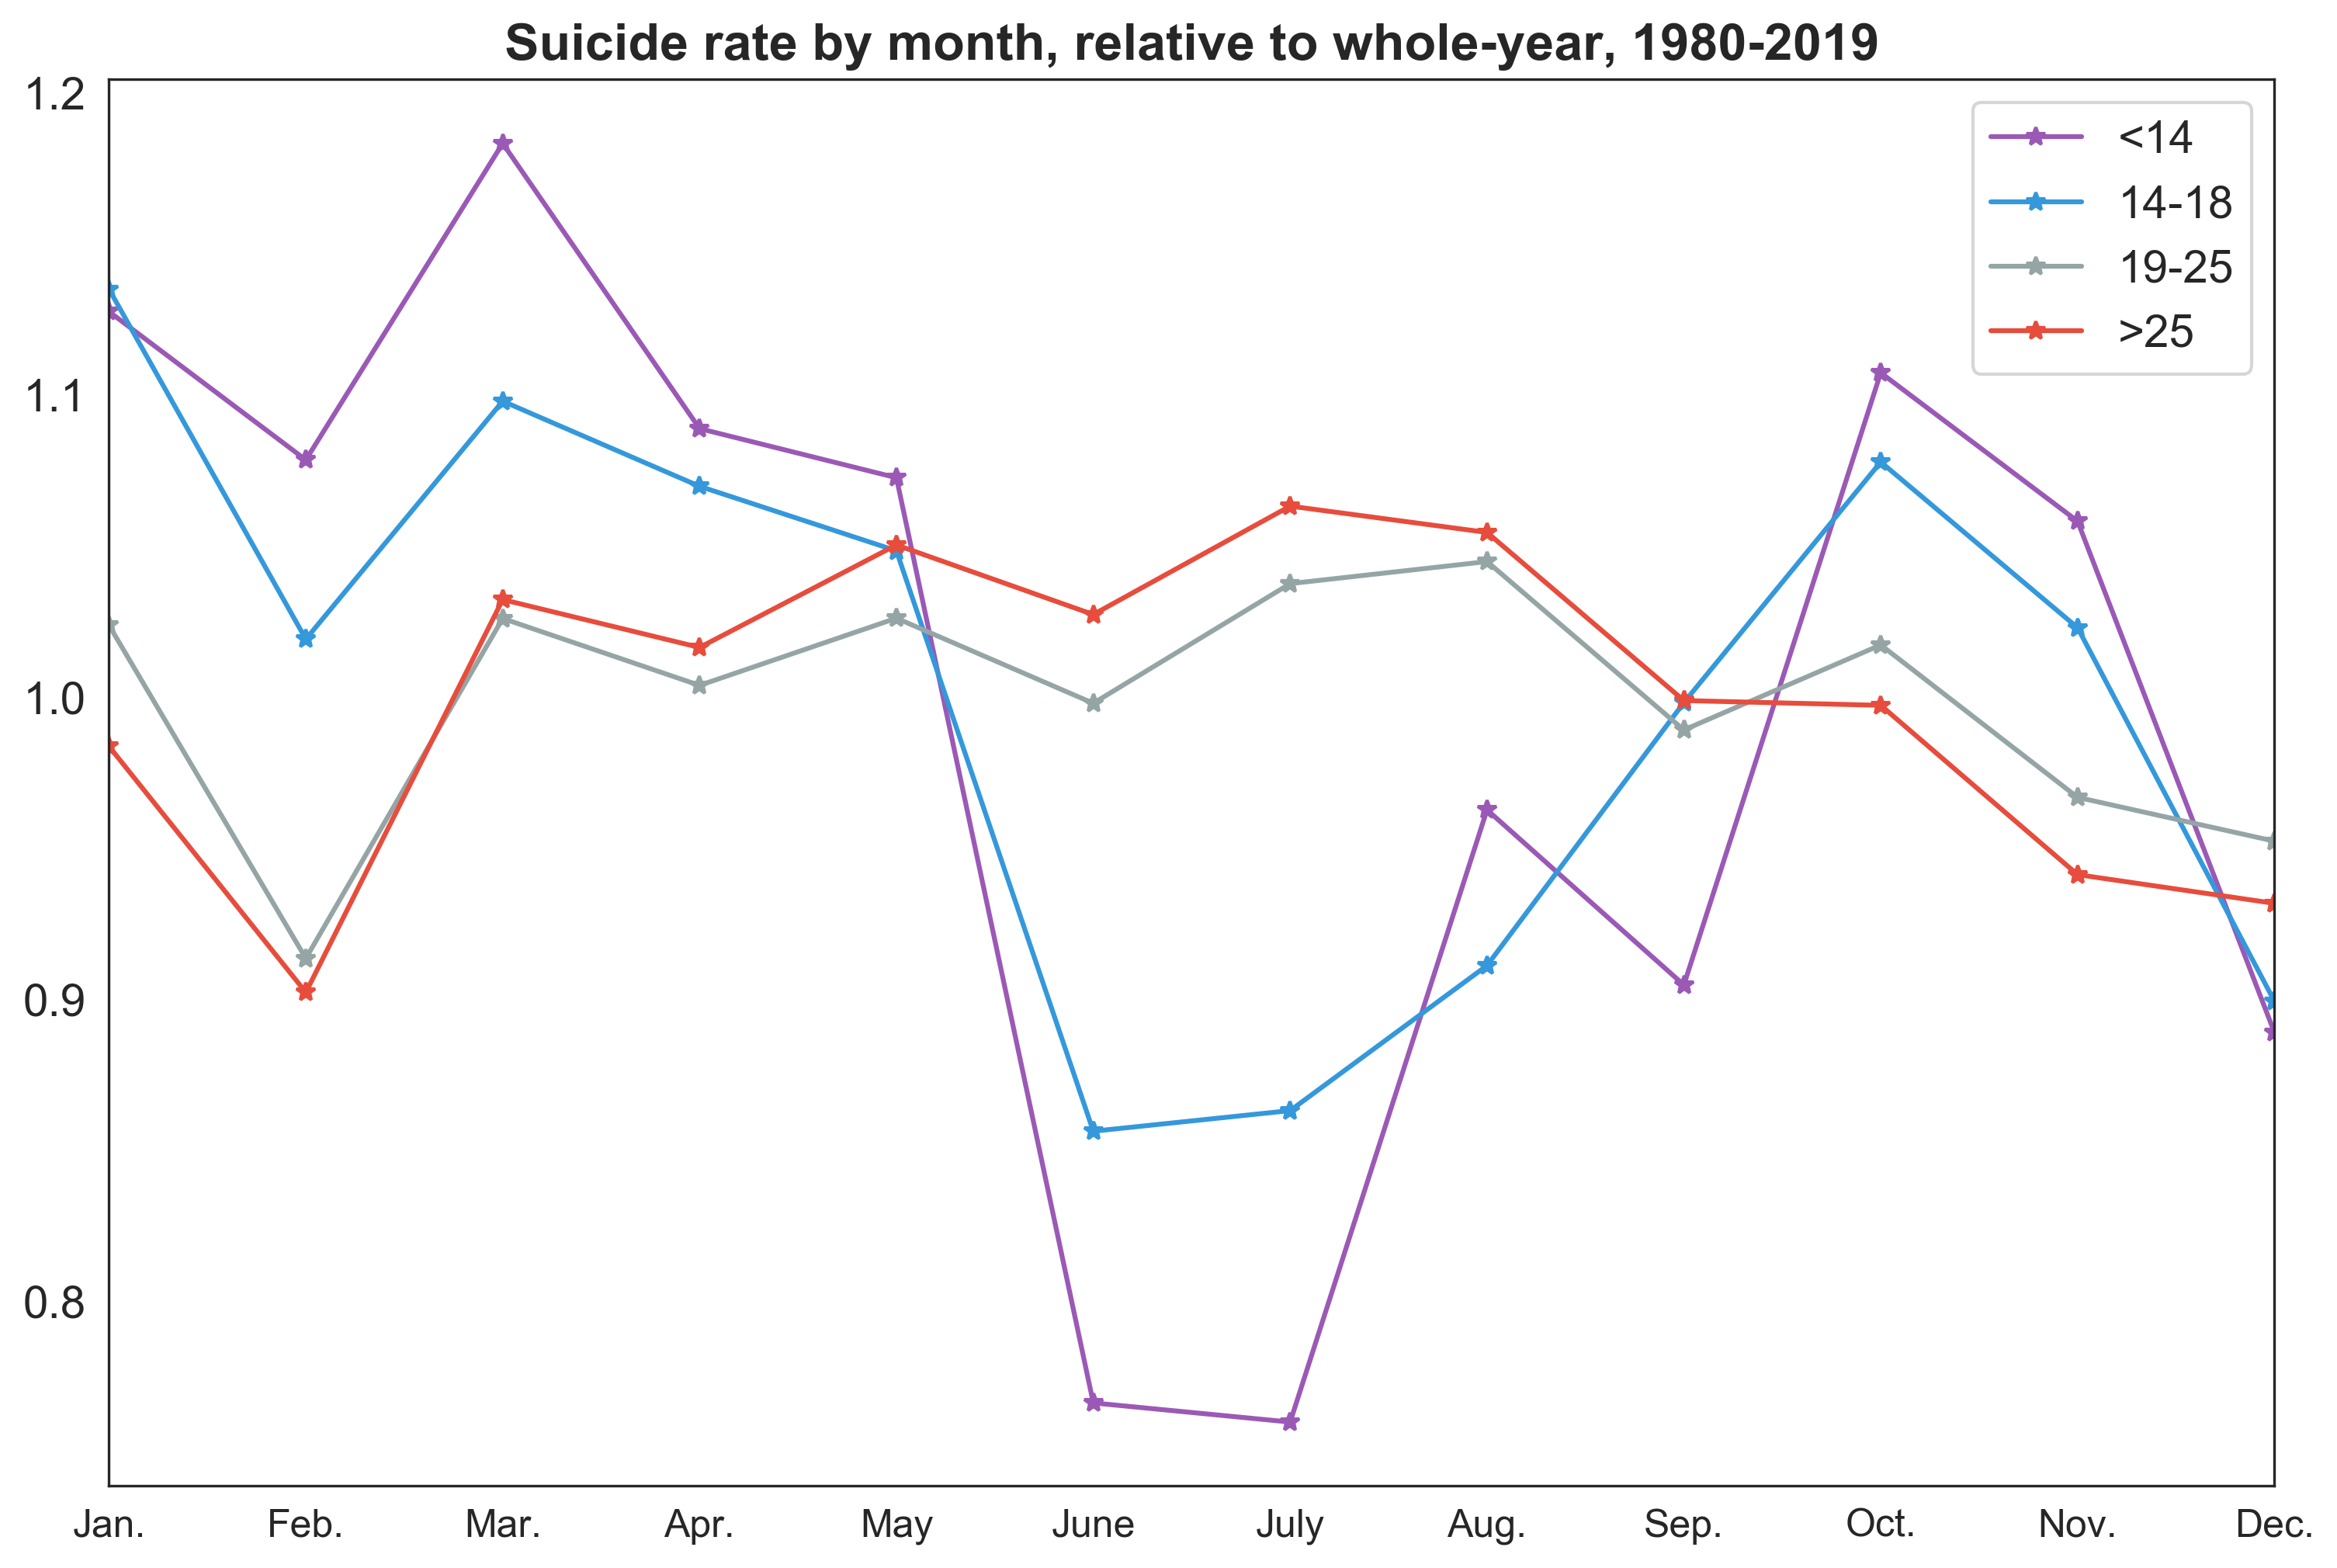
The Hansen and Lang figure has the 14-18 age group and the 19-25 group; this figure also includes a line for those under age 14 and one for those above age 25. The pattern for those under age 14 is even steeper.
Note that suicide rates vary by age – older age groups have higher suicide rates – so I normalize the suicide rate each month by the average over the entire year to make the monthly pattern readable. Here’s the rate by month, not normalized, where you can see the level differences, and the pattern is still evident but harder to see:

Here’s a back of the envelope calculation to help interpret the magnitudes:
If US teen suicide rates were as low during the school year as they are during the summer, then there would be ∼2600 fewer teen suicides per year. Eek.
This replication and extension convinced me, at least, that this seasonal pattern is not a data fluke. Another check that Hansen and Lang do is to look individually at each year of monthly data, by age group, and to regress suicide rate by month on a dummy for is_summer. The coefficient is (depressingly) stable:
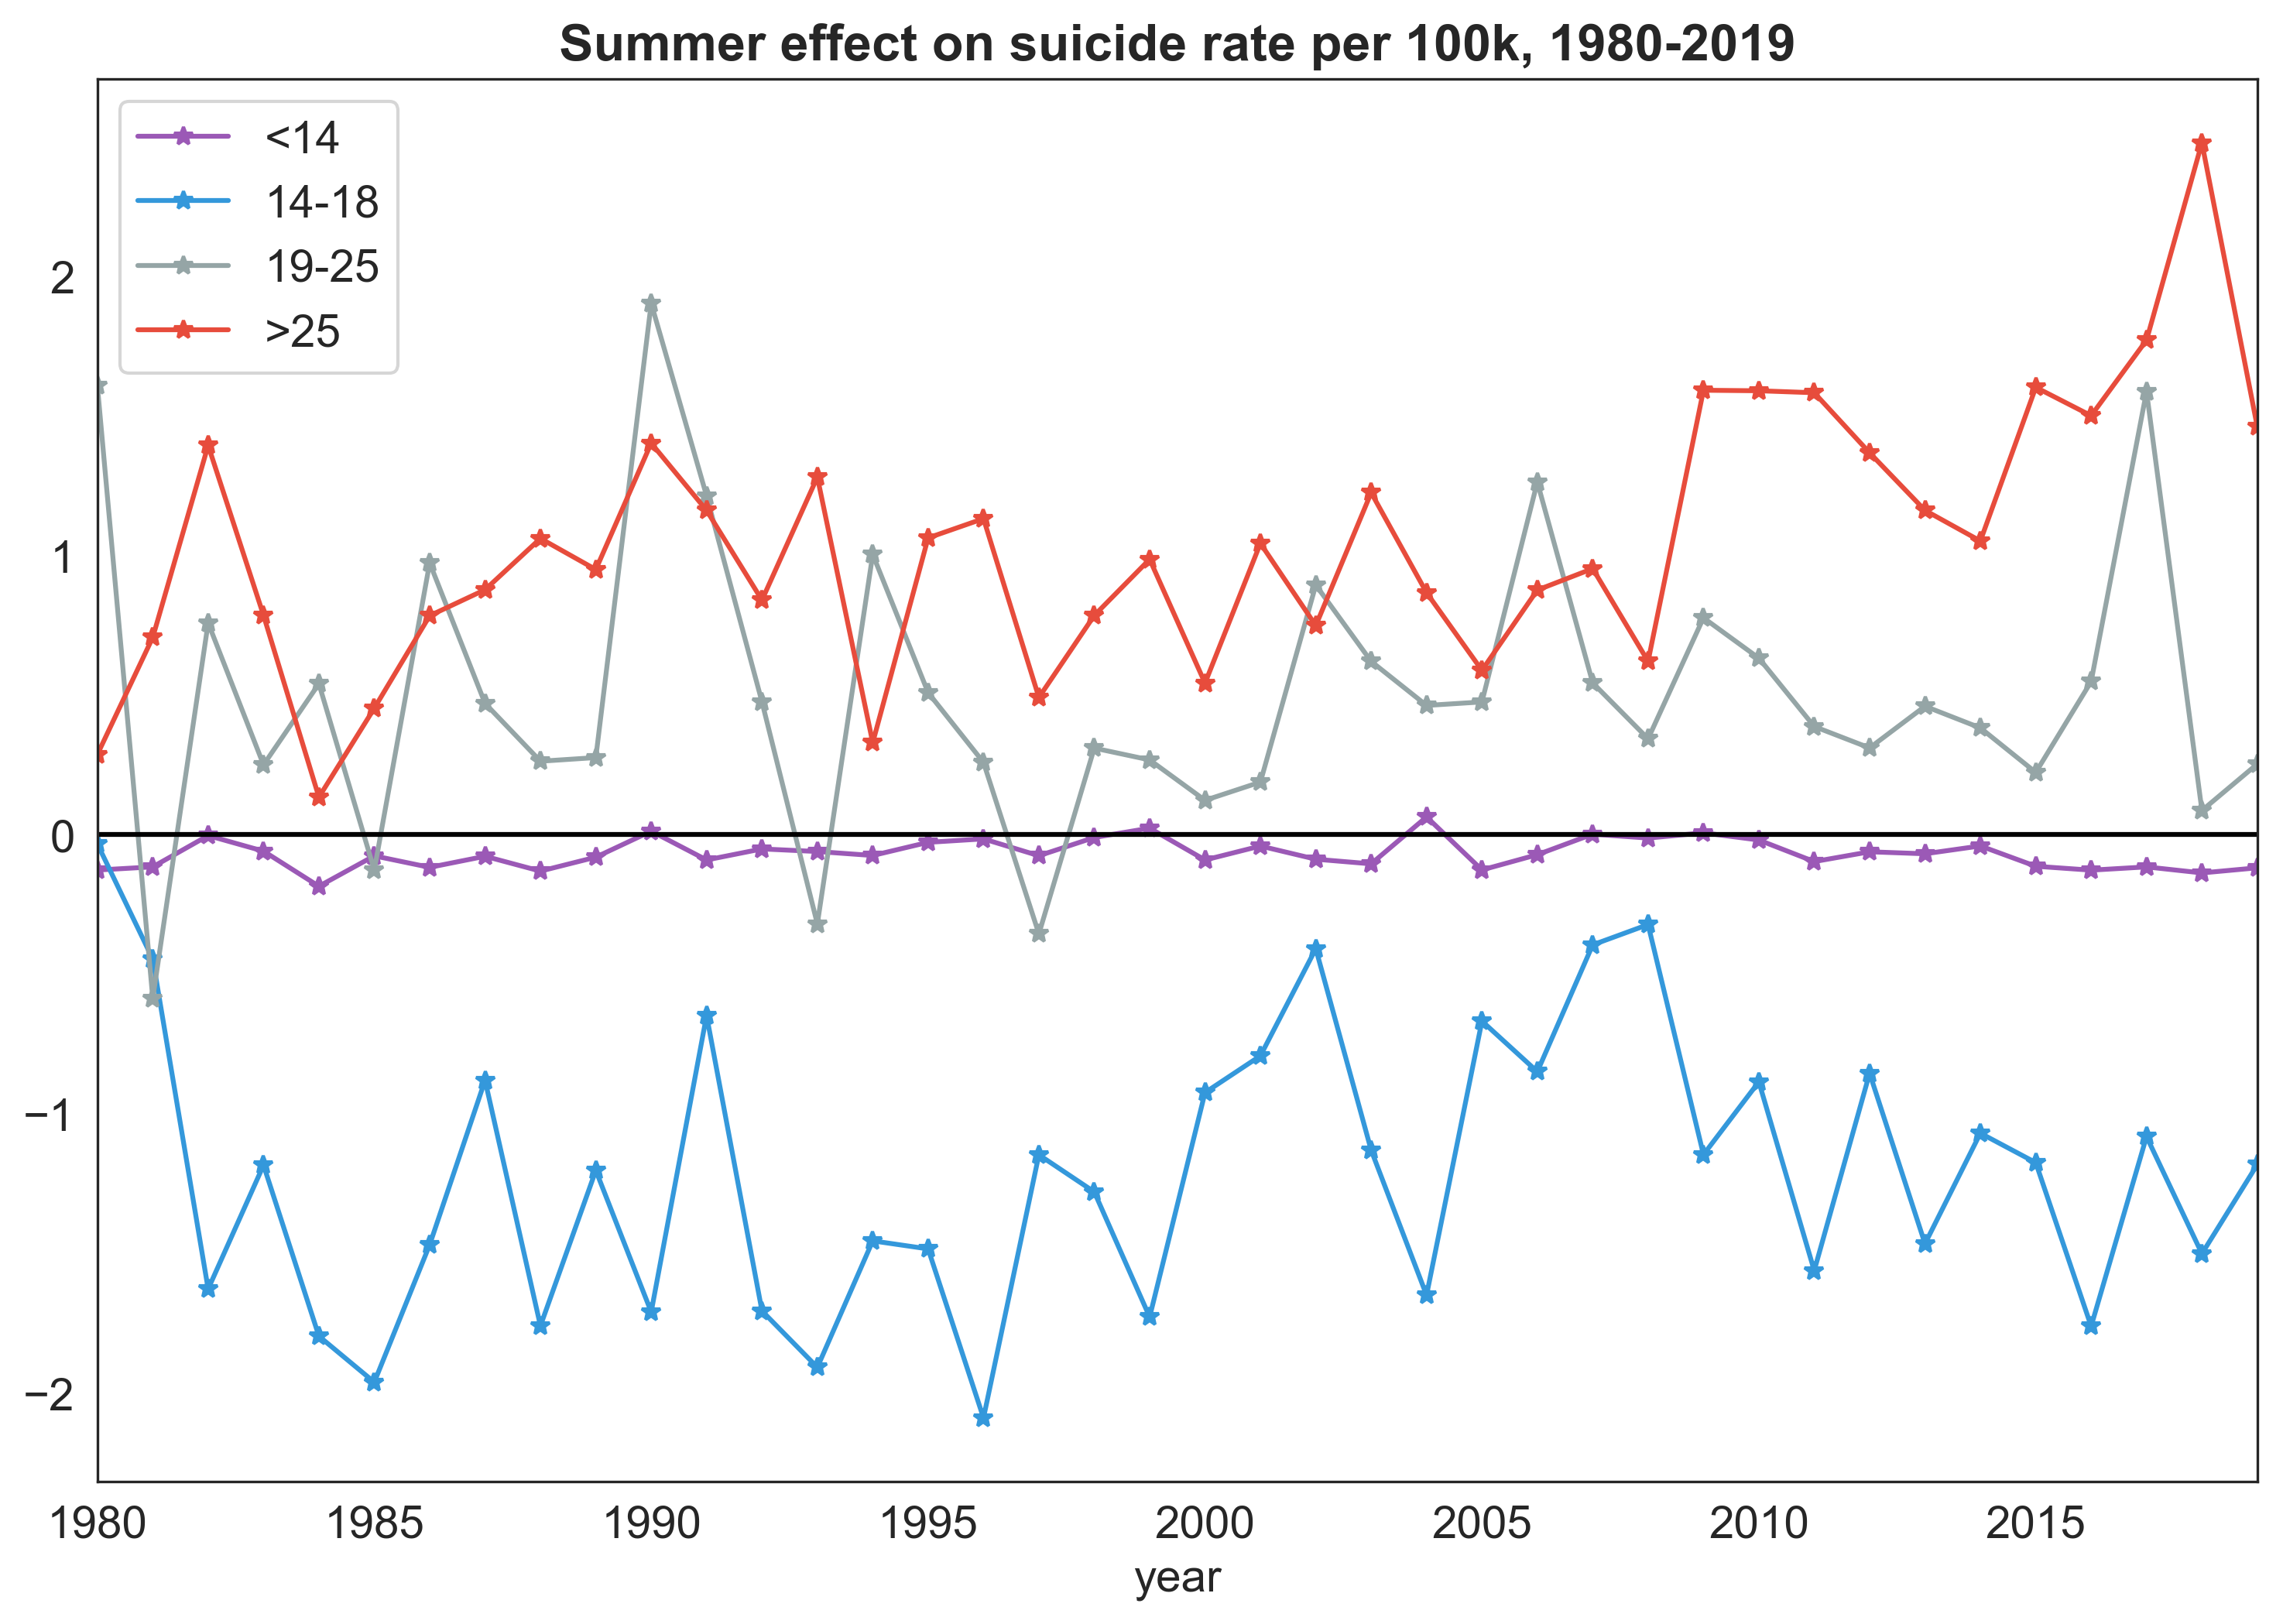
(Note that I did this regression in absolute terms, hence why under-14 has a coefficient close to zero – again suicide rates for this group are comparatively low.)
Another thought is that seasonal patterns might be attributable to something related to seasonal affective disorder (SAD). For one thing, you can check out the Hansen and Lang paper where they compare states with differing levels of sunlight to argue that SAD is not the cause. Second, note the comparison with adults: adults have a higher suicide rate during summer months, despite the existence of SAD.
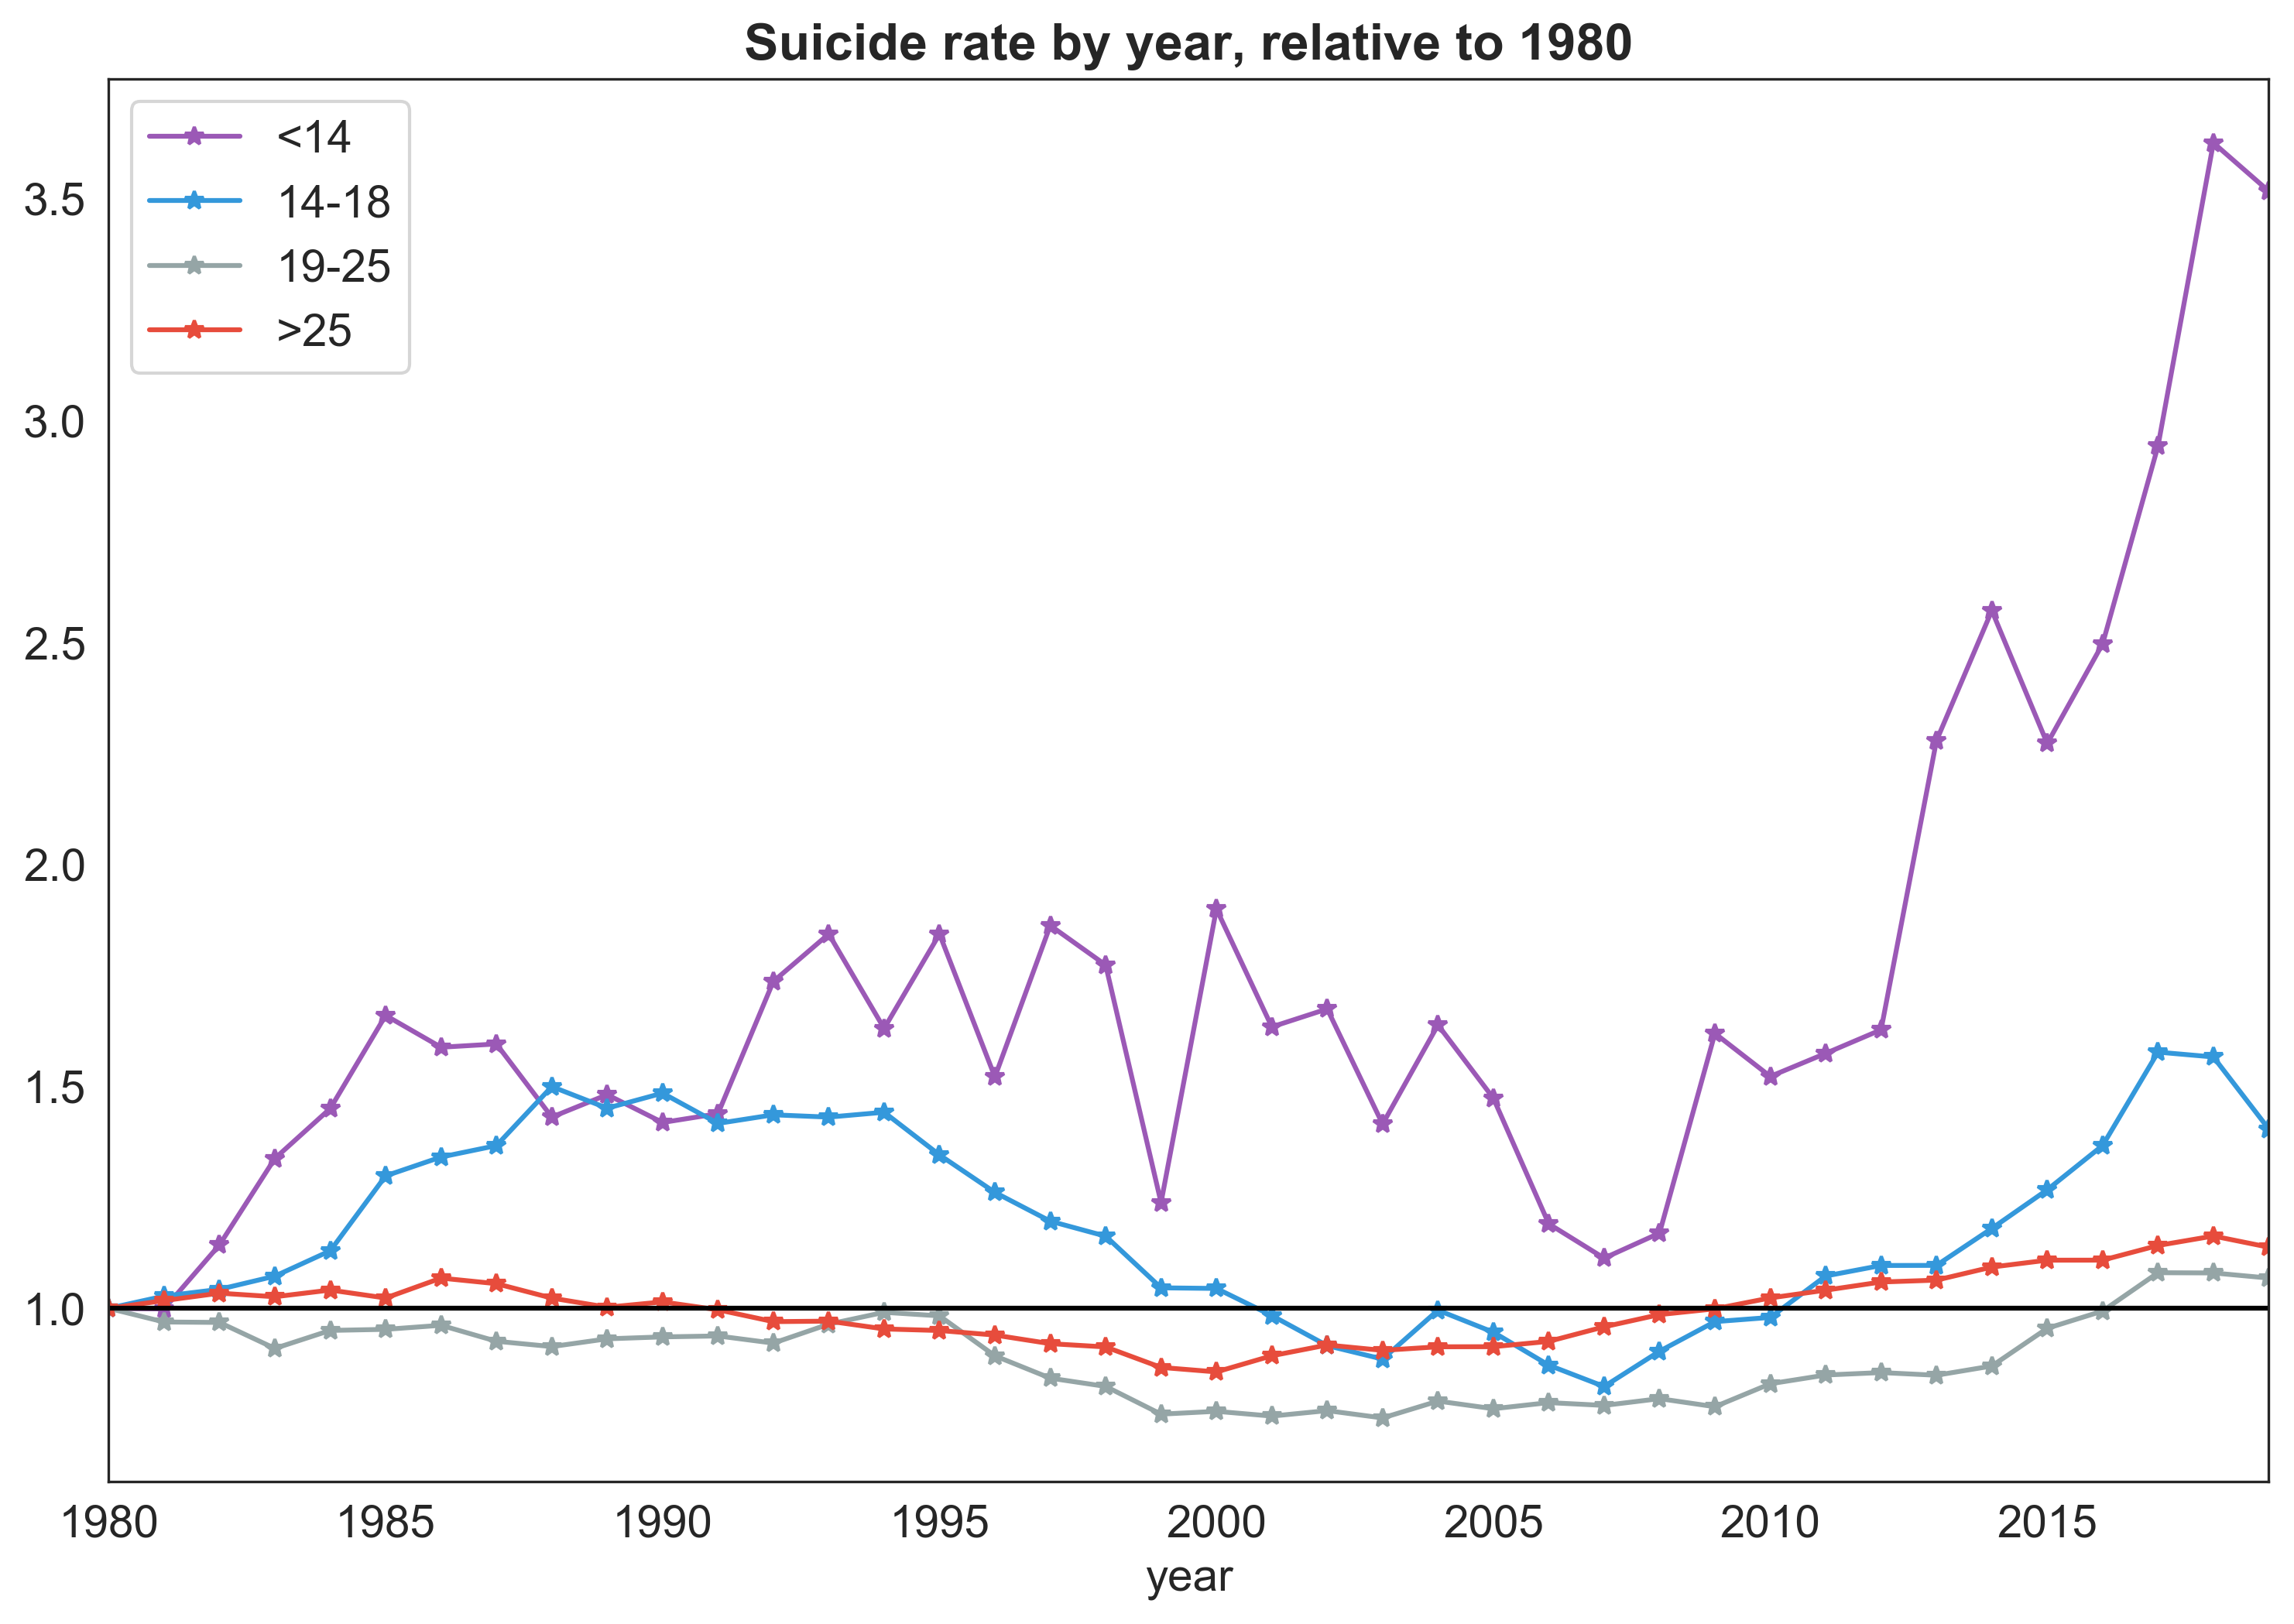
The background context here is that US suicide rates have risen substantially in the last 15 years, particularly in relative terms for the <14 group, which makes the study of this – and other “public mental health” issues – especially important and underrated, in my opinion.

(This was my motivation when I dug into this data originally a few years ago. As regular readers will know, I spend most of time thinking about macroeconomics: how to abolish recessions and the grave evil of (excess) unemployment. But: some welfare trends are so tangible they’re hard to ignore.)
The optimistic view is that suicide rates for older age groups are to some extent just returning to their early-1990s level. That’s not much optimism, at all, though. (You might also think that this is just a shift in the age distribution within bins – this is not the case. An example.)
That the “summer effect/correlation” seems to have been constant while total suicides have fluctuated around is maybe a point against the idea that ‘increasing school-related stress’ is driving teen suicide rates.
I emphasize that this analysis very much IS a correlation, not a strong argument that “school causes teen suicide.”
You could think about identification strategies to tease out the causal effect of school on suicide rates or mental health, and hopefully someone will do that (!). A crucial challenge is that any quasi-randomness which “increases school time” (for example) not only “increases school time” but also necessarily has a bunch of other effects – increasing education being only one of many to consider. The exclusion restriction is not your friend here.
Even setting aside causality (which you should absolutely not!), a big question here in my view is the data itself: could this be driven by reporting differentials? Are school officials during the school year more likely to be willing to classify a death as a suicide, compared perhaps to family members over the summer?
Even if the data is completely correct, the causal mechanism is not at all obvious. School and mental health would certainly be one possible channel, but there are other possibilities. Alcohol is a major risk factor in suicides. Perhaps(?) during the school year, teens are more likely to have access to and consume alcohol – though the same pattern for under-14s perhaps pushes against this.
Alternatively, perhaps schooling affects timing but not the outcome – if forced schooling were abolished, would total suicides fall, or would there be merely a shift in timing?
All this said, it’s not even clear what the implications of a causal finding would be – we’re not(?) going to stop sending kids to school.
There are other margins of adjustment, though, as we like to say. School administrators and educational policymakers could think harder (???) about or allocate more resources to mental health programs for students.
“Better school, not less school”? This seems like the most promising avenue for additional research on this topic – research which surely exists – i.e. examining specific policy programs. Besides programs directly related to mental health, you could think about how these outcomes are affected by school start times, school funding cuts, standardized testing rollouts, or school shutdowns, as some off-the-cuff examples.
The data stops in 2019 since that’s the latest year for which we have full data.
I can’t say it will be telling to see the 2020 data, during the not-at-all-quasirandom remote learning era. But it will certainly be a unique data point, for lack of a better word.
(Here’s evidence on ER visits for suicide attempts since the pandemic showing an increase among girls, particularly in winter/spring 2021. The general seasonal patterns discussed above are also evident in this higher-frequency ER data. See also: a Scott Alexander review of existing evidence on suicide during the pandemic for all ages.)
I do want to use this section as an excuse to force an analogy, though. After the fact, it sure seems like many would argue that the US and other countries underinvested in public health: underinvested in detection of, treatment for, and prevention of macro-scale public health events.
There’s a strong case to be made that, similarly, we are underinvesting in public mental health: detection of, treatment for, and prevention of society-level mental health crises as they already exist and also as they may emerge.
(I am uniformed – please inform me! – but my bias is for bigger-picture policies in the standard utopian and technological directions here: break the licensing cartels; allow telemedicine; allow right to try for apps and/or pharmaceuticals; and, maybe, allocate more research funding to the issue.)
US data is overrated. What about outside the US?
A 2017 paper from “Economic Analysis of Suicide Prevention” cites a number of studies from other countries in a review, but most don’t zoom in on those of school age in particular and/or have poor data.
Of the more-relevant studies, Singapore data shows little seasonal variation; Finnish data shows an increase in the autumn with the start of school; Chinese data shows no clear seasonal pattern. Most striking, unfortunately, is Japan, where daily data is available:
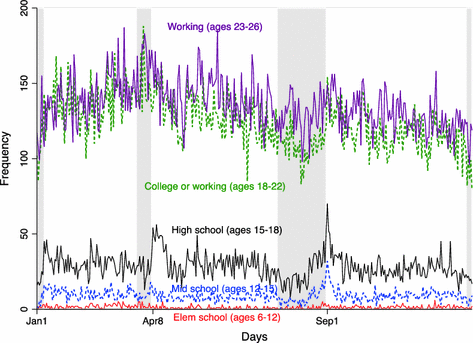
You can see spikes in teen suicides immediately after each school break (the shaded areas).
This is extremely stomach-twisting stuff if you/I think about it for too long, so let me end things here.
I have little interaction with the mental health research community, and there are probably obvious points here that someone should point out to me. (Please do!)
Code and the cleaned data are here; you should be able to run the Jupyter notebook from top to bottom to download the original raw data (∼50GB) and fully replicate every graph or number here.
Thanks to Charlie Rafkin for useful discussion on this topic.