basilh@virginia.edu
@basilhalperin
TLDR: “GDP percentage growth is slowing down” emphatically does not mean that “the rate at which human lives are improving” is slowing down, even under the assumption that GDP is all that matters for human wellbeing. Percentage growth slowdowns are even consistent with wellbeing growth accelerating.
1. Here’s one perspective. The average percentage growth rate of GDP per capita in the US has fallen nearly monotonically by decade: From 2.8% in the 1960s to 0.8% in the 2000s, before rebounding to 2.5% in the recovery years of the 2010s. Pretty depressing! The growth rate is mostly slowing down.

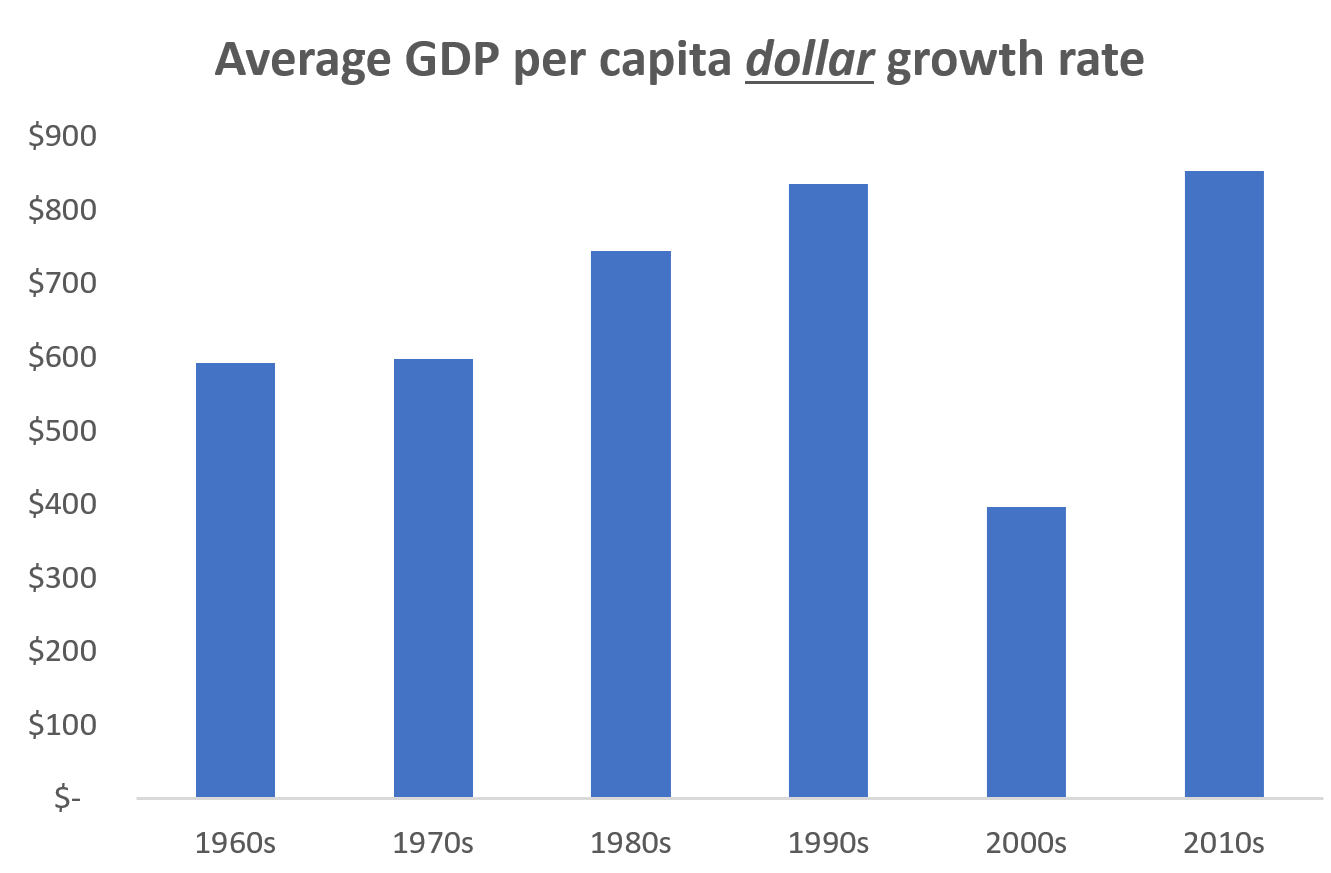
2. Here’s another perspective. The average dollar growth rate of GDP per capita in the US has risen nearly monotonically by decade, excepting the depression years of the 2000s: From $592 in growth per year in the 1960s to $852 in the 2010s. Pretty good! The growth rate is speeding up.

3. Why should we privilege the percentage growth rate metric over the dollar metric? In contemporary discussions of our “productivity slowdown” and “great stagnation”, or debates on “how to speed up growth”, inevitably the first chart with percentage growth is shown.
I can’t eat 3 percent GDP growth; but 850 dollars in cash, I certainly know what to do with that. Does that mean that we should say “growth”, quote unquote, is not slowing down?
This isn’t a trick question: we should not in fact attach so much importance and status to percentage growth rates. But dollar terms isn’t the right metric either.
Ultimately, what we care about is welfare: how happy are people. And in that case, the relevant comparison has to use a cardinal measure of utility: how fast is utility growing?
We’re going to need to do a bit of math to go further.
Say that – just to make the point as clear as possible – utility is only a function of GDP: higher GDP means more happiness. (Thinking of utility as depending on other factors – which it definitely does! – only strengthens the point.)
Also suppose that GDP is growing at a constant rate g:
y(t+1) = y(t) * exp(g)
If utility is log of GDP, U(t)=ln[y(t)], then percentage change in GDP exactly equals growth in welfare:
U(t+1) - U(t)
= ln[y(t+1)] - ln[y(t)] = ln[y(t+1)/y(t)] = ln[exp(g)]
= g
Thus, under log utility, we have a direct justification for caring about percentage growth: it is exactly informative of how fast welfare is growing.
Log utility is a very specific, knife-edge functional form, though!
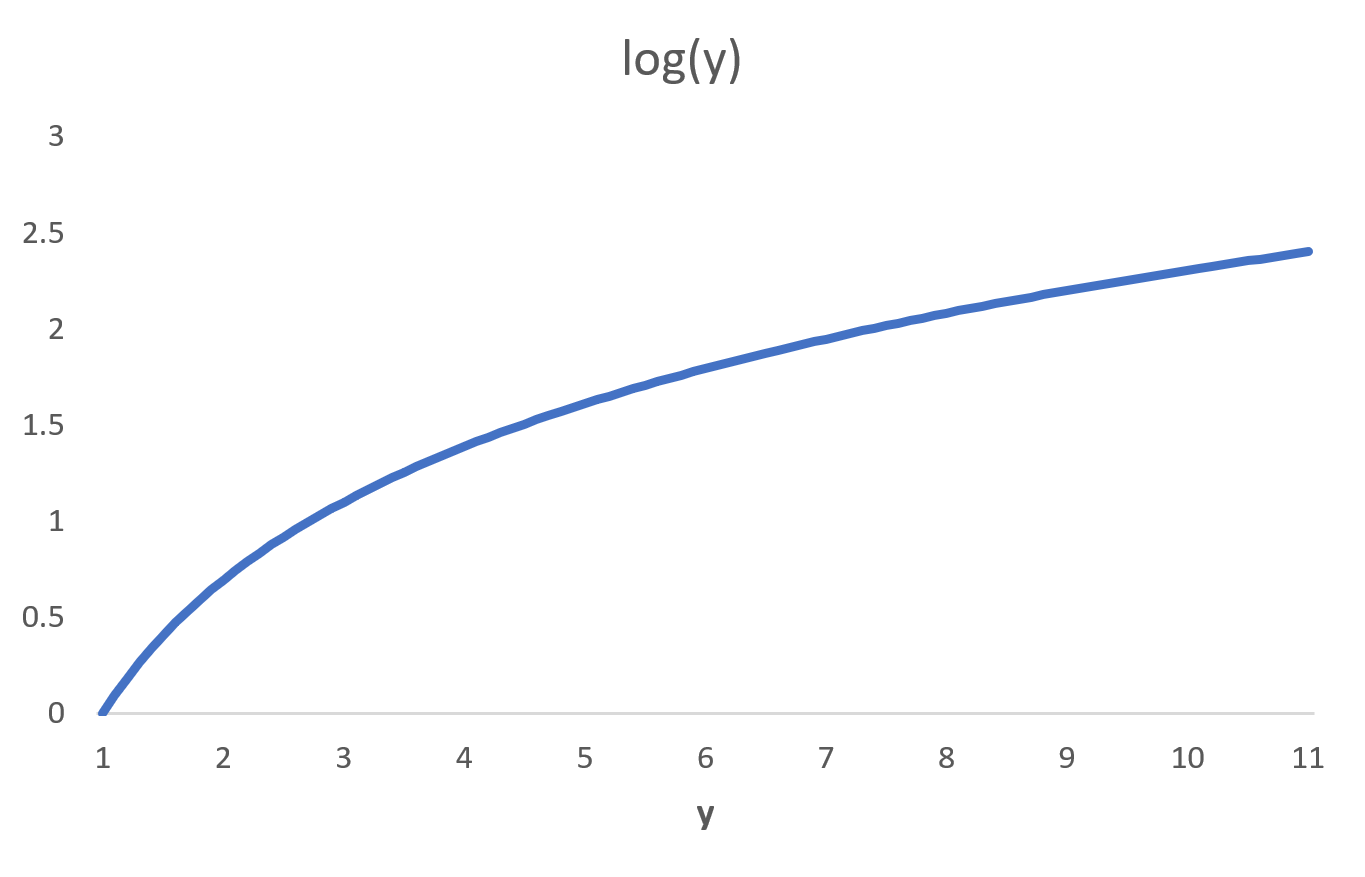
More generally, think of the graph of ln(y): it’s upward sloping, at a diminishing rate – it’s curved. That is: there is diminishing marginal utility from higher GDP. (Diminishing marginal utility rules everything.)

Here’s the key question for any non-log utility function: How quickly does marginal utility diminish? Or graphically, how curved is the function (in GDP space)? More curved than log, or less curved than log?
For example, consider the frequently-used CRRA utility function. If the CRRA coefficient is less than 1, then the utility function is less curved than log – marginal utility diminishes slowly. Vice versa for a coefficient greater than 1. (With a coefficient equal to 1 the function becomes log).
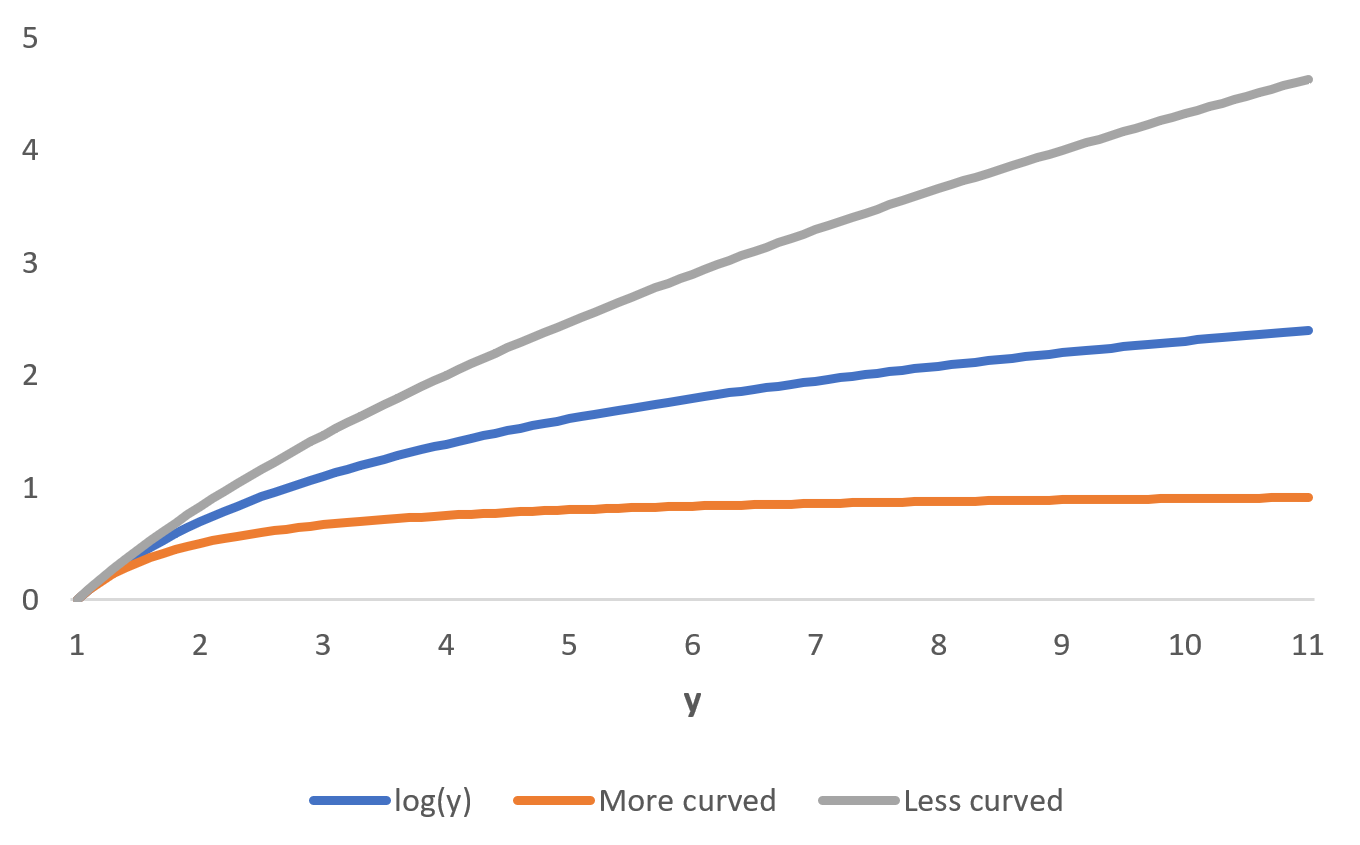
You can see visually what I mean by more-or-less curved here: where “more curved” is CRRA with coefficient of 2, and “less curved” with a coefficient of 0.5.

The gray line – a “less curved” utility function – is closer to being linear than the other two “more curved” lines.
Here’s the resulting kernel of insight from thinking about more vs. less curved:
1. If the utility function is “more curved” than log – and marginal utility thus diminishes faster – then welfare grows slower than g. That is: if utility is more curved than log, then we need accelerating percentage growth in GDP just to maintain the same growth rate in well-being.
2. If the utility function is “less curved” than log – and marginal utility thus diminishes slower – then welfare grows faster than g. That is: if utility is less curved than log, then decelerating percentage growth in GDP can even be consistent with accelerating levels of welfare.
(In the extreme case when utility is not curved at all – when utility is linear – that is precisely when the dollar metric for growth is the right metric.)
The intuition for these points comes exactly from diminishing marginal utility: with log utility and constant percentage GDP growth, we saw that welfare growth is constant. If marginal utility diminishes faster than log, then the level of utility is of course growing slower; and vice versa.
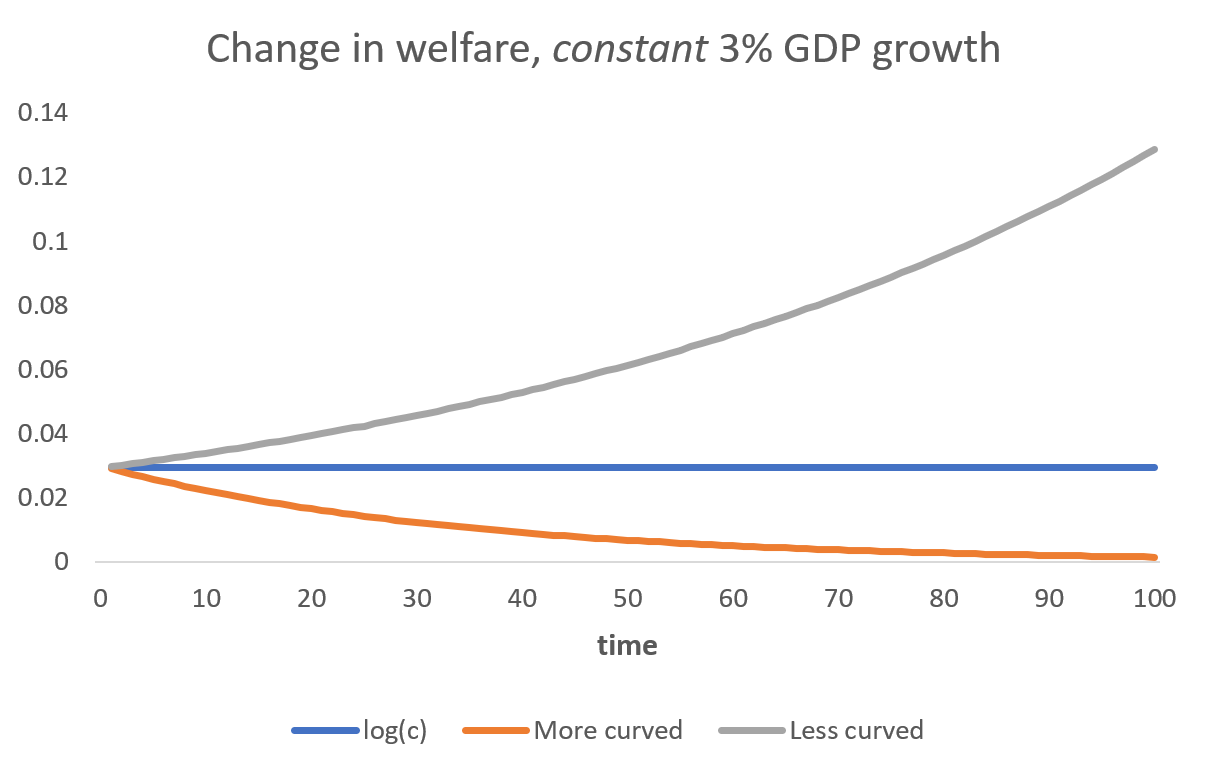
The next figure shows this. Constant GDP growth leads to constant welfare gains under log, as time passes; accelerating welfare gains under “less curved”; and decelerating gains under “more curved”.

TLDR: “GDP percentage growth is slowing down” emphatically does not mean that “the rate at which human lives are improving” is slowing down, even under the assumption that GDP is all that matters for human wellbeing. Percentage growth slowdowns are even consistent with wellbeing growth accelerating.
Finally, to translate all this to academic-ese: even a balanced growth path model, like the semi-endogenous growth model, can have ever-accelerating welfare growth; it just depends on the utility function.
(PS: The vast majority of models of economic growth are built around functional forms that result in constant percentage growth in key variables in the long run. Thus from a modeling perspective, you may also be interested in GDP percentage growth as a test of how well these assumptions fit the data: is it constant in the long run, or not.)